Tag Archives: Learning Analytics

The Stories Data Can Tell: “Dataclysm: Who We Are (When We Think No One’s Looking)”

9780385347372_custom-84ac93a546bfd78bead01a68de71b9e85e675dcd-s300-c85

Dataclysm Who We Are (When We Think No One’s Looking) Christian Rudder, Random House

Data has this marvelous capacity to show patterns of human behavior, tell stories and even predict what we are going to do next. It’s the premise of “Dataclysm”—the stories data tells about what we value, how we think and act. I chose the book as one of my 2015 reads because of the big mountain of data that education institutions are collecting; I wanted to get a glimpse into how data predicts behavior, to learn about privacy boundaries, and was hoping to get a glimpse into how data might help us design, develop and deliver better learning experiences for students. A tall order. Not surprisingly I didn’t find answers; but I did learn about the power that data holds and discovered a  good report by EDUCAUSE that does have some of the answers I was looking for.

The biggest takeaway from “Dataclysm” is the incredible potential data holds, which can translate to education sector. On its own data has no value, but with the right software data can inform, support, predict and help. Most organizations including education institutions collect mounds of data. Some is put to good use though according to the EDUCAUSE report the majority of data is used to satisfy credentialing or reporting requirements rather than to address strategic questions. And much of the data collected is not used at all (Bichsel, 2012). Education data is of abundance. Students generate a significant chunk. Every time a student logs-on to the LMS, school portal, or uses school software, printers, e-books, etc. data is collected. Every click, key stroke, time on web pages, links clicked are recorded.

The Book

I definitely think it’s good. … All of this data — everything in the book and generally anything you read online about people’s behavior on sites — is aggregated and anonymous. Nobody’s looking at your personal account. But when you put all this stuff together, you’re able to look at people in a way that people have never been able to look at people before. — Christian Rudder, Author of “Dataclysm: Who We Are” NPR Interview

Rudder, author of the book and quote above, is also co-founder of the dating site OKCupid. He gets most of the content for his book from data on his site though he also draws from Twitter and Facebook. Rudder describes how he takes data, without identifying details such as user names, and analyzes it to create narratives that describe human behaviors. The book is full of stories the data tells about race, gender and politics, which at times was disturbing. Not the writing, which is witty and entertaining, but the results of his analyses. Rudder calls his work more of a ‘sociological experiment’, examining human behavior, values, even biases by looking at (online) actions, words, choices, link clicks, and ratings.

‘Dataclysm’ was interesting—not instructive but insightful. Since finishing the book I’ve recognized how, what many label as disruptive services, are data-driven. Uber for instance, the new taxi service. Its business model rests entirely upon big data. Uber uses complex algorithms to aggregate data into actionable info that quite literally drives the business (Marr, 2014). Another—a new email program by Google, SmartReply, can write email responses for us by using machine learning to ‘work on a data set that they cannot read’ (Corrado, 2015). Whatever that means. But the gist is, its BIG data behind it.

Big Data and Education

Screen Shot 2015-11-05 at 2.44.58 PM

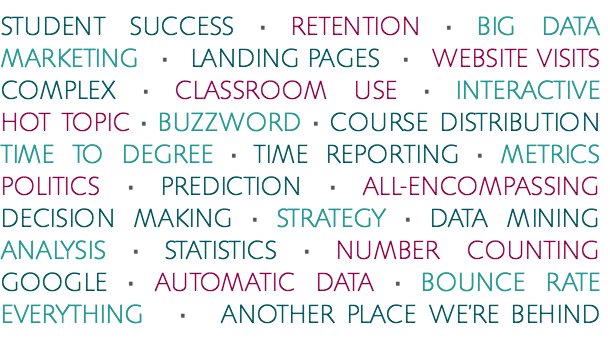
“When you hear the word ‘analytics,’ what comes to mind?” Responses in Wordle (above) to this question posed to focus groups for ECAR 2012 study on analytics. (Bichsel, 2012)

EDUCUASE defines analytics as “a tool used in addressing strategic problems or questions”.  Analytics are typically applied to institutional data and learning or academic data. Yet it appears that the potential of big data in education is yet to be tapped. The field is broad, complex and there are numerous barriers as described by Bichsel.

One of the major barriers to analytics in higher education is cost. Many institutions view analytics as an expensive endeavor rather than as an investment. Much of the concern around affordability centers on the perceived need for expensive tools or data collection methods. What is needed most, however, is investment in analytics professionals who can contribute to the entire process, from defining the key questions to
developing data models to designing and delivering alerts, dashboards, recommendations and reports.

Though there are many institutions working extensively in learning analytics with the goal of helping students succeed and improving outcomes. One is University of Michigan who have helped create a standard that ensures third-party vendors (e.g. LMS providers) provide institutions with access to data generated by their students—not to withhold the data which can be critical for schools looking to use it to support and inform student success (Mathewson, 2015). Another is Purdue University who has done extensive work in academic analytics with its LMS program Course Signals (Research on Course Signals, n.d.).

Conclusion
Rudder states in his book that we are on the ‘brink of a revolution—a data revolution‘. I think he may be right. The education sector may take some time to figure it out, but for those that get it right, it will be revolutionary.

Further Reading

References

What-the-heck Happened in 2012? Review of the Top Three Events in Education

This was an extraordinary year in the education sector providing bloggers and journalists  with much content to write about: ed-tech start-ups, big data, open courses attracting thousands of students and even some institutional drama  in the mix. Several bloggers I follow have done an excellent job in summarizing the years’ events; my review is on a lighter note, a digest if you will on the three most significant topics [in my opinion] of 2012. Each event includes a synopsis of the topic with links to blog posts and articles summarizing and exploring what-the-heck happened in 2012.

THE MOOC! The movieimage by Guilia Forsthye

THE MOOC! The movie, image by Guilia Forsthye

1) The xMOOC movement caused a certain level of mania, hysteria and irrational decision-making by numerous educators and their institutions in 2012. It also sparked controversy, discussion, change—just what is needed to address the challenges facing education. Audrey Watters of Hack Education wrote a stellar summary, The Year of the MOOC, chronicling developments over the entire year. From another perspective, Tony Bates wrote a thoughtful piece, ‘Why MOOCs?’ in his year-end post Online learning in 2012: a retrospective. 

With the influx of several universities partnering to create massive platforms for MOOCs, [MITx, Coursera and Udemy], co-founder of the original MOOCs, Stephen Downes [with George Siemens] clarified the terminology for MOOCs [which educators are surely grateful] before things started to get really difficult to follow, “I am now referring to the MOOCs offered by Coursera, Udemy and MITx (among others) as xMOOCs, to be compared with cMOOCs, which is what we offer in our connectivist classes.” (Downes, 2012).

iStock_000013752327XSmall

2)  Ed tech Start-ups were HOT this year, and fueled by the significant sums of money investors were willing to part with. A few attracted millions of dollars including Udacity, Coursera and Knewton, of which collectively have taken in well over fifty million dollars to date.There are numerous other smaller start-up companies wanting to take advantage of the current quest within the education sector for improved access and quality, and to lower costs.  Edudemic wrote a good review, 25 Start-ups Worth Knowing. The best article I read this year about an ed-tech start-up, was Simplicity and Order for All, about Jack Dorsey founder of Twitter and a new platform ‘Square’. Dorsey is quirky, artistic and brilliant. The article sheds light on the motivation behind an idea—what sparks and drives the innovation in the first place.

EdSurge, a newsletter about ed tech start-ups published a list of the Top Educational Tools of Q2, 2012 based upon web traffic from readers.  Another helpful resource, from Jane Hart founder of Centre for Learning and Performance Technologies (C4LPT), is the Top 100 Tools for Learning, which Jane has published for the past four years. Click here the 2012 edition; it’s a worthwhile read as Jane includes a slide share presentation that describes each tool.

iStock_000008045233XSmall3) Big [Educational] Data, data, data everywhere also sparked much discussion and a quest to find new and novel ways to use the tremendous amount of data that educational institutions are keepers of. Though as more discussions and reports are generated, policies and decisions made, questions began to surface that included, ‘how can we use the data effectively’? And ‘what are the ethics behind big data in the collection and reporting of’?

I wrote several posts within the last few months about learning analytics, a branch of big data, including this one about instructors and students, How instructors can improve student engagement with learning analytics. George Siemens is a leading scholar in this area, has conducted several key notes, written several papers, and in October of 2012 posted content from the Second International Conference on Learning Analytics and Knowledge that he was involved with.

Looking Forward to 2013
The year of 2012 was tumultuous but exciting at the same time. Though I’ve covered only a fraction of the year in this post, the links to the blogs provided will direct you to more comprehensive coverage.

What will 2013 bring?  What are your predictions for next year? I have a few of my own which I’ll share in early January. Thank you to you, my reader, for taking the time to read this blog and, to those of you that have shared your own insights with comments. I wish you Happy Holidays and restful season.  I look forward learning from you, and with you in 2013.
Debbie

Dream or Nightmare? The Ethics of Learning Analytics

Just because it [academic data] is accessible doesn’t make it ethical (Boyd & Crawford, 2012).

What are the implications of higher education institutions collecting student data and compiling a multitude of reports based upon students’ online clicks, page views, time logged on, and electronic notes? Do educators have a responsibility to tell students what they are doing? These are interesting questions that education institutions should be wrestling with in this era of Big Data.

I’ve written several posts recently about learning analytics, emphasizing the need for meaningful analysis, student-centered reporting, and transparency. However, I admit to having reservations about analytics and its role in education. Not only is there potential for abuse and manipulation of data, but I am concerned about privacy and student rights. Surprisingly, there has been little written about the moral implications and the potential nightmares that analytics could create. Simon Buckingham Shum a leading scholar in learning analytics research, led a talk Learning Analytics: Dream or Nightmare? for EDUCUASE’s online spring focus session, (webinar recording available here). Shum discusses Big Data in education focusing on analytics in K-12 and higher education settings. Shums’ talk promotes deep thought as he highlights  the positive aspects of academic analysis but also its dark side. In this post I highlight some of the concerns put forth by Shum, the ethical considerations we as educators should be concerned about, and the questions we should be asking.

Simon Buckingham Shum, EDUCAUSE Webinar, 2012

Questions to Ask
If we look at where the idea of using Big Data to improve productivity and growth came from, we need look no further than to the business sector. Businesses thrive on analyzing customer data, sales, market performance and inventory logistics. Can we apply the same principles to education?  In his talk, Shum asks a rhetorical question about analytics using the slide at the right to emphasize his point. BusinessAnayltics.edu or LearningAnalytics.com? Can we treat academic data the same way as business’ treat data?  IBM thinks so. I attended a webinar several months ago where IBM was sharing a case study about a college where its analytics platforms were implemented.  I was uneasy throughout the  webinar, I heard over again and again words such as  strategy, performance, achievement, strategic planning. Rarely did I hear the words, student, learning or development. I am not suggesting that IBM is incapable of providing valuable expertise, I am only using this sliver of insight I gained through a brief webinar to highlight the bigger issue, which is the need to ask questions that include, ‘how  should we approach educational data?’, ‘who should have access?’ and ‘how does academic data differ from other types of data?’.

What do students think?
Speaking of breadth, do students know the depth and breadth of data that is collected about them within the academic platform (LMS such as Moodle or Blackboard) they use consistently? And if they do, what are their responses? Some students will not care, yet others may be vehemently opposed. However, when students are involved in the discussion of how to use the data, and are part of the conversation, which Shum suggests, the concern of privacy and ethics becomes clearer. Transparency is essential. Grand Rapids Community College blog features an excellent article, Obligation of knowing: Ethics of Data Collection and Analytics, which suggests using transparency to create trust. Letting students know how data will be used, and how they will benefit is a good place to start.

Simon Shum, Webinar

Solutions
Simon Shum closes his webinar with two slides, the first with an image of a man holding a magnifying glass, asking ‘who gets to hold magnifying glass’, implying that educators should be considering not only who should be analyzing and viewing student data but why. The final slide, an image of a student holding a mirror, suggests that analytics should be used as a mirror for learners to become more reflective, and less dependent. Yet it is up to the institution to determine how data will be used which will determine the result— either a nightmare scenario where analytics breed resentment and myopia, or a dream scenario. In the dream scenario, analytics can create a generation of tools that support and develop learners, where students become self-directed, responsive and armed with the skills needed for the 21st century.

Resources:

Photo Credit: Personal Data, by Charlie Collis (highwaycharilie), Flickr

Learning Analytics for Instructors Need to be Loud and Clear

Learning Analytics…less data more insight. Analytics primary task is not to report the past, but to help find the optimal path to the desired future. (Shum, 2012)

Learning analytics, [analyzing students’ online behaviour patterns to support learning improvement] is not about data collection, but helping learners and instructors make connections with the data. I attended a webinar this past week with Campus Technology, Grand Canyon University: How we are improving student outcomes using LoudAnalytics on the LoudCloud Ecosystem. Grand Canyon University of Arizona shared results from their learning analytics pilot project using LoudAnalytics from LoudCloud, a company which presents themselves as a learning ecosystem, the next-generation of learning management systems. In this post I identify what kind of analytic reports are essential and the most useful to course instructors, which are not, and why this is so. The findings in this post I gathered from the webinar and content from week four of the course Current/Future State of Higher Education.

Meaningful’ Data for the Instructor
I wrote a post last week that addressed how student data gathered from online behaviours from a school’s platform, can put the learner in the ‘driver’s seat’, essentially in control of his or her own learning. A dashboard which gives real-time info on a student’s ‘stats’, can be a visual tool to help learners reach their goals, identify problems and contribute to  motivation. However, what about the course instructor? What analytic tools are available through the LMS platform that can provide meaningful data, data that is consumable – in a usable form that encourages instructors to take action in real-time?

Grand Canyon University Webinar,  Slide #14

To the left is an example of a report from LoudAnalytics that displays data about students’ progress in a visual format. Students are represented by circles; the size of the circle representative of the hours spent on the course home page (interacting with course content, etc.) and the colour of each circle representing a letter grade. I see this as a ‘snapshot’ view of  students progress holistically, but don’t see this report on its own as providing ‘actionable’ data. Time spent within the LMS does not translate always to grades and engagement level, but is just one metric.

Grand Canyon University Webinar, Slide #47

The report to the right however, does appear to provide constructive data for the course instructor. When instructors consider the previous report and the one here, the instructor is able to do something with it. For example upon review, the instructor might want to reach out to student #2 (and potentially one or two others) with an email to the student that might read like this:

Dear [name of student], it appears that you have an assignment outstanding, and have not participated in a forum recently. I am concerned about your progress in the class. There are several resources available for support, …..”

There are limitations to this scenario I’ve described here, it is one-dimensional given we don’t have complete information, but the idea is that the indicators provided in this report are specific about student actions, or non-actions that give the instructor something to work with.

What Data is NOT Helpful
It is information about student actions, i.e. missing assignments, non-participation in discussion forums, low test grades, that is valuable for instructors, what I call ‘actionable’ data. Other data, such as number of times logged on to the course  home page, or the number of minutes spent within the platform, is not meaningful or of much practical use. I suggest that platform providers (i.e. Moodle LoudCloud etc.) consider generating reports that are focused and specific to the users needs (users defined within three groups: student, instructor and administrator). However, making too many reports available will detract from the value of the analytics. For example, the report below shows the time in minutes a student spent within the LoudCloud system, which gives a snapshot of student behaviour, but, I don’t see how this information is useful for the instructor. Perhaps it might be, if considered in conjunction with other reports, but then we get into data overload.

Grand Canyon University Webinar, Slide #48

Furthermore, just because we can measure something, doesn’t mean it is valuable or even useful. Another example is the program that Course Smart, the e-textbook provider is launching to give course instructors reports on student engagement. I wrote about this last week, yet I use this again as an example to show how reports are created from data that end up being inconsequential.

It [Course Smarts’ program] will track students’ behavior: how much time they spend reading, how many pages they view, and how many notes and highlights they make. That data will get crunched into an engagement score for each student. The idea is that faculty members can reach out to students showing low engagement (Parry, 2012).

I have a hard time imaging how instructors will use this information. The problem from the get-go is that Course Smart assumes that student engagement is defined by the number of electronic ‘notes’ made in the e-book and how long the student spends ‘reading’ the textbook. Not only is this logic flawed, but as one of my readers pointed out, it has a ‘big brother’ feel about it. I do agree, and I will be writing about the ethics of learning analytics next week.

Closing Thoughts
Learning analytics can be a powerful tool for instructors, yet only when meaningful data is compiled in such a way that it is user-friendly, relevant and actionable, in other words reports must be loud and clear.  LoudCloud is onto something here, I very much like their visual presentation. Yet LoudCloud and other LMS providers need to narrow down the number of analytic reports made available, customizing what they offer to the users needs. Make it clear, specific and meaningful.

Next post: Dream or Nightmare: The Ethics of Learning Analytics, Online Learning Insights

Resources:
Grand Canyon University: How we are improving student outcomes using Loud Analytics on the Loud Cloud Ecosystem. (November 13, 2012) Campus Technology Webinar (now on demand)

LT-C2012 Learning Analytics Symposium, (2012),  Simon Buckingham Shum, Slideshare
Introduction to Learning and Knowledge Analytics Syllabus, (2011), An Open Course
Putting Learners in the Driver’s Seat, Online Learning Insights

Putting Learners in the Driver’s Seat With Learning Analytics

Steering WheelI read something disturbing this week from Inside Higher Ed, Measuring Engagement with Books

“The big buzz in higher ed is analytics,” said senior vice-president of marketing Cindy Clarke, of the e-textbook provider Course Smart. “Based on the issues there are with institutions around improving the return they’re getting on their investment in course materials, we realized we had a valuable data set that we could package up [emphasis added].” (Tilsley, 2012)

Coincidently, last week’s topic in the course I am taking Current/Future State of Higher Education (#CFHE12) was Learning Analytics, the same topic this article refers to. It’s a promising area of study and is a ‘hot’ topic in higher education right now. Data, in the form of students’ online behaviours obtained by measuring clicks, keystrokes, time logged-on, number of ‘hits’ [visits] on web pages, is collected and then compiled into ‘meaningful’ information.

Yet Course Smart’s [in my opinion] program is an example of learning analytics gone awry. The ‘packaging up’ as mentioned by Ms. Clarke refers to the program Course Smart developed with data on students’ reading patterns. The program looks at how students interact with the e-textbooks, the number of times a student views a page and for how long, highlights made, etc. Course Smart compiles this ‘data’ and sends a Student Engagement Report to professors.  Are these metrics a true measure of a student’s level of engagement?  It seems that student engagement covers a far broader scope than time spent reading a textbook.  Even if the report did provide meaningful indicators, how would an instructor actually use it to teach more effectively?

Analytics in higher education is considered by some to be a panacea to its woes. Yet it’s  complex, sensitive, and almost onerous given the abundance of student data that is collected by institutions. In this post I’ll give an overview of the three areas of analytics, micro, meso and macro to provide clarity and context as explained by a guest presenter in a recent CFHE12 webinar, Simon Buckingham Shum, Associate Director of Knowledge Media Institute, Open University, UK. I’ll also share how learning analytics is used to help students learn as discussed by educator Erik Duval, Professor at Katholieke Universiteit Leuven, Belgium, during another #CFFE12 webinar, and finally how educators can use analytics to help students take charge and ownership of their learning, essentially put them in the driver’s seat.

The Big Picture of Student Data
When we speak of learning analytics, we are at the ground floor of Big [academic] Data. Data analytics in academia has the potential to support decision makers, academic researchers, policy makers, instructors and students. Simon Shum described the layers of analytics this way:

What Questions Should Data Answer?
At the macro level, institutions share data with others, compare and determine what is useful to influence and support decisions on educational funding models, policies and for International comparisons. At the institutional level [meso level], analysis includes examining student progress and related data to make programming decisions, identifying at-risk students by predicting student performance, and making curricular decisions. Shum’s approach to analysis is holistic, he puts forth questions that educators should be asking when making decisions about how to use data effectively at the meso and micro level:

  • What are we measuring and why?
  • What problem are we trying to solve with the data?
  • What level of results should we share with the learner?
  • What are the ethical considerations?
  • How can we create a functioning ecosystem that uses data effectively and responsibly?

Dashboard of student progress displayed throughout a course. Designed by students in a research project with Duval.

Analytics in the Real Time – Helping Students
Duval, not only a professor, is chair of the research unit on human-computer interaction analytics, and his research focuses on how data can provide valuable feedback to the learner. He gathers and analyzes student behaviour patterns through online behaviours as it relates to their learning, which he shares with his students, there is 100% transparency. Information for the learner comes in several forms, one of which is a dashboard that provides a snapshot view of how the student is doing at a given point in the class. This view is designed to trigger self-reflection where learners can view their progress, compare their performance with others in the class. When asked how students respond to viewing others’ performance, Duval says he spends considerable time at the beginning of the class explaining, discussing and reviewing the purpose of the reports, how to use them and what they mean to students’ overall learning.

This approach is also in ‘real time’, it is actionable — students [and instructors] have access to feedback as the course progresses. Students can adjust, make decisions, and take action as needed. Instructors can also reach out to struggling students, ‘intervene’ with resources and support. Duval describes this as putting the learner in the driver’s seat, which is the name of the conference held in Belgium recently on Learner Analytics.

How can Instructors use Learning Analytics at the Ground Level?
There are questions and concerns about how much data students should have access to, with FERPA guidelines and privacy issues, educators must tread carefully. That being said, we can begin by asking the right questions: what do we want students to achieve, and how can data help them? What do we need to do to educate students about the data, how they can use it?

What can Educators do?

  • Identify what tools are available within your learning management system for data analysis. I’ve included in previous posts YouTube videos that provide instruction on how to use LMS tools, and other strategies for analytics. See the resources section for the links.
  • Be part of the discussion with faculty and administrators about learner analytics – ask questions, focus on ‘why’.
  • If presented with analytical tools or reports, determine how they can be used to support learners through instruction or intervention.
  • Become familiar with how analytics can help instructors be more effective in helping students learn.
  • Review  programs based upon analytics that are used at other institutions: Purdue’s Course Signals ProgramUniversity of Michigan Academics Analysis Program and Community College at Rhode Island program,Connectedu.

Closing thoughts
Learning analytics has tremendous potential for education, though I am cautiously optimistic about its use in higher education. I am far from an expert, but I see the value in giving students ownership of their learning through tools provided by analytics,  dashboards for example, similar to Duval’s. We need to involve the student in this conversation – it’s not the data that’s the solution to the challenges that higher education is facing, it’s the students. Let’s put them in charge, give students the tools to make the decisions to make learning meaningful, put them in the driver’s seat.

Resources:

Conference, Learners in the Drivers Seat, Belgium
How Instructors Can Use Analytics to Support Student Engagement, Online Learning Insights
SoLAR, Society for Learning and Analytics Research
Learning and Knowledge Analytics, Resources
Engage: Test by ACT to predict student success in college
Erik Duval’s Slideshare, Presentations
Understanding Learning Academics and Student Data, MindShift

How Course Instructors can Improve Student Engagement with Learning Analytics

Online learning is dynamic, active, at times disorganized, yet with the effective use of tools, instructors can adapt and adjust instruction to create a rich learning experience. This is part two in a three-part series on learning analytics.

Learning analytics is a powerful tool that can help instructors adapt their course to create an engaging, robust learning environment. Analytics, the newest tool to  improve student learning, is a branch of the latest application of Big Data, used exclusively at one time for big-box retailers such as Wal-Mart, Home Depot and Fortune 500 companies, has now become mainstream in education. Learning analytics in the education sector collects data whenever students log-on to their institutions learning management platform [LMS] such as Blackboard or Moodle. Each student click known as a ‘view’ in Moodle, is associated with a time stamp, a record of the time students spent with each resource.  Analytics involves the mining of  data, analysis and reporting, which creates [potentially] useful information about student learning. The Society for Learning Analytics and Research (SoLAR), dedicated to exploring the role of analytics in teaching and learning defines it this way,

Learning analytics is the measurement, collection, analysis and reporting of data about learners and the contexts for purposes of understanding and optimizing learning and the environments in which it occurs.  SoLAR

But notice earlier I stated potential; I believe that the data alone does not tell a complete story. In this post I’ll share how course instructors can use analytics as a tool to improve  engagement and quality of learning outcomes by examining activity data and student outputs [writing assignments in this case]. I use an example from my workplace to show how we: 1) assessed ‘data’ from LMS reporting tools, 2) identified how students interacted with course content through learning activities, and 3)  made decisions for course design for this course and others based upon the results.

How to Use LMS to Analyze Course Design
Within a LMS, [Moodle in this example] reports are available that show how students engage with each resource by ‘views’ (clicks) for the entire class or even by student. A resource, for the purpose of this post, is defined as course content [web page, outside link, videos clips, etc] or an activity [discussion board, wiki project etc.] In this post I used a course from my workplace  as the example, an online history course for credit with eight students.

We examined student patterns of interaction with content and application through the class discussion boards and learning activities. Learning activities consisted of students interacting with content, in the form of pre-selected web resources which provided students with an interactive learning experience requiring exploration and examination of primary sources.  Discussion boards consisted of student responses to instructor questions which addressed text-book reading and/or content from pre-recorded lectures. Below is a screen shot of one of the weeks within the course [week five] activity report, which includes the collective views by students for each resource.

Screen shot a section of a Moodle report which displays the number of student views each resource had collectively for the given week.

In each instance we examined the quality of the students’ application, which for each, required students to write two or three paragraphs describing what they learned [through interaction with content either web resource or text/video]. Instructions are below for one part of the content exploration.

Activity that focuses on the content, the Influenza Epidemic, one topic within week’s content.

The application portion of the learning activity from above.

When comparing this activity to others within the course and discussion boards, the Influenza Epidemic received the highest number of views. Upon closer analysis [with another report], students spent more than one visit on this activity, and invested more time.

Next, we examined the quality and quantity of students’ responses to the various activities, it appeared students were spending time with the content in the above activity –  and it is evident from reading student responses how effective the activity was.  This is important – the numbers or data alone did tell the complete story, it was this in conjunction with the quality of students responses that we were able to conclude that interactive activities with quality content, requiring students to interact with primary sources (in this instance), with the requirement of a written product, produces the best results.

Conclusions from Analysis:

  • Students are more likely to engage with content when the activity involves interactive resources. The activity then becomes an effective pedagogical method when students are required to produce or create an output after reflection and analysis.
  • Number of views on discussion boards can be an indicator of level of interest of a given topic. This differs from the number of postings, as some students may read the postings but not create a post.
  • Identifying which activities not only engage students but produce quality analysis – where students use higher order thinking skills, is critical to designing and adapting online courses.
  • Reviewing reports in conjunction with student outputs is essential to gain a holistic perspective on student performance.

The example I share here is only a fraction of the tools and reports available to analyze and examine student behaviours.  Investing time in learning how to use the tools most effectively is time well spent for the online course instructor; time that can lead to well designed courses resulting in application of critical thinking skills and positive learning outcomes.

Resources:

Photo Credit: Magnifying Glass, by Rafael Anderson Gonzales Mendoza